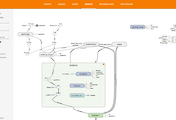
Tensorflow 에서는 알고리즘이 학습하는 과정을 시각화 하기 위한 툴을 제공하고 있습니다.
바로 TensorBoard 라고 하는 데이터를 시각화해서 그래프로 보기 좋게 표현해주는 툴입니다.
<TensorFlow Mechanics 101 튜토리얼 예제>
튜토리얼 예제를 통해서 실행한 텐서보드 화면입니다. 이와 같이 학습하는 과정에서 발생하는 데이터를 로깅하고 그 데이터를 그래프로 볼 수 있어 아주 유용하게 사용됩니다.
텐서보드를 사용하기 위해서는 먼저 summary 객체를 정의해 주어야 합니다.
# Build the summary Tensor based on the TF collection of Summaries.
summary = tf.merge_all_summaries()
그런 후에 세션을 생성해 주고
해당 세션을 인자로 하는 summary_writer를 생성해줍니다. tf.train.SummaryWriter의 첫번째 인자는 데이터를 파일로 내리기 위한 directory 정보입니다.
# Create a session for running Ops on the Graph.
sess = tf.Session()

# Instantiate a SummaryWriter to output summaries and the Graph.
summary_writer = tf.train.SummaryWriter(FLAGS.train_dir, sess.graph)
이렇게 준비가 되었으면,
sess.run()을 통해서 세션에서 한번 실행을 해주고,
로깅을 남기고 싶은 데이터를 summary_writer.add_summary() 함수의 인자로 하여 추가해줍니다.
마지막으로 summary_writer.flush() 를 호출하면 실제 disk에 파일을 씁니다.
# Write the summaries and print an overview fairly often.
if step % 100 == 0:
  # Print status to stdout.
  print('Step %d: loss = %.2f (%.3f sec)' % (step, loss_value, duration))
  # Update the events file.
  summary_str = sess.run(summary, feed_dict=feed_dict)
  summary_writer.add_summary(summary_str, step)
  summary_writer.flush()
이렇게 하여 생성된 데이터 파일을 텐서보드를 통해서 Web에서 볼 수 있습니다.
서버 콘솔에서 아래와 같이 tensorboard 명령어를 통해서 로그 디렉토리를 지정하여 실행하면 웹서비스가 port 6006으로 구동이 됩니다.
$ tensorboard --logdir=.
'Tensorflow' 카테고리의 다른 글
| 13. Tensorflow 시작하기 - tf.contrib.learn Quickstart (2) | 2016.11.07 |
|---|---|
| 12. Tensorflow 시작하기 - TensorFlow Mechanics 101 (0) | 2016.11.06 |
| 10. Tensorflow 시작하기 - flags (3) | 2016.11.04 |
| 9. Tensorflow 시작하기 - Session (2) | 2016.10.25 |
| 8. Tensorflow 시작하기 - placeholder (0) | 2016.10.24 |


댓글